5. Window Layout
TREvoSim’s main window
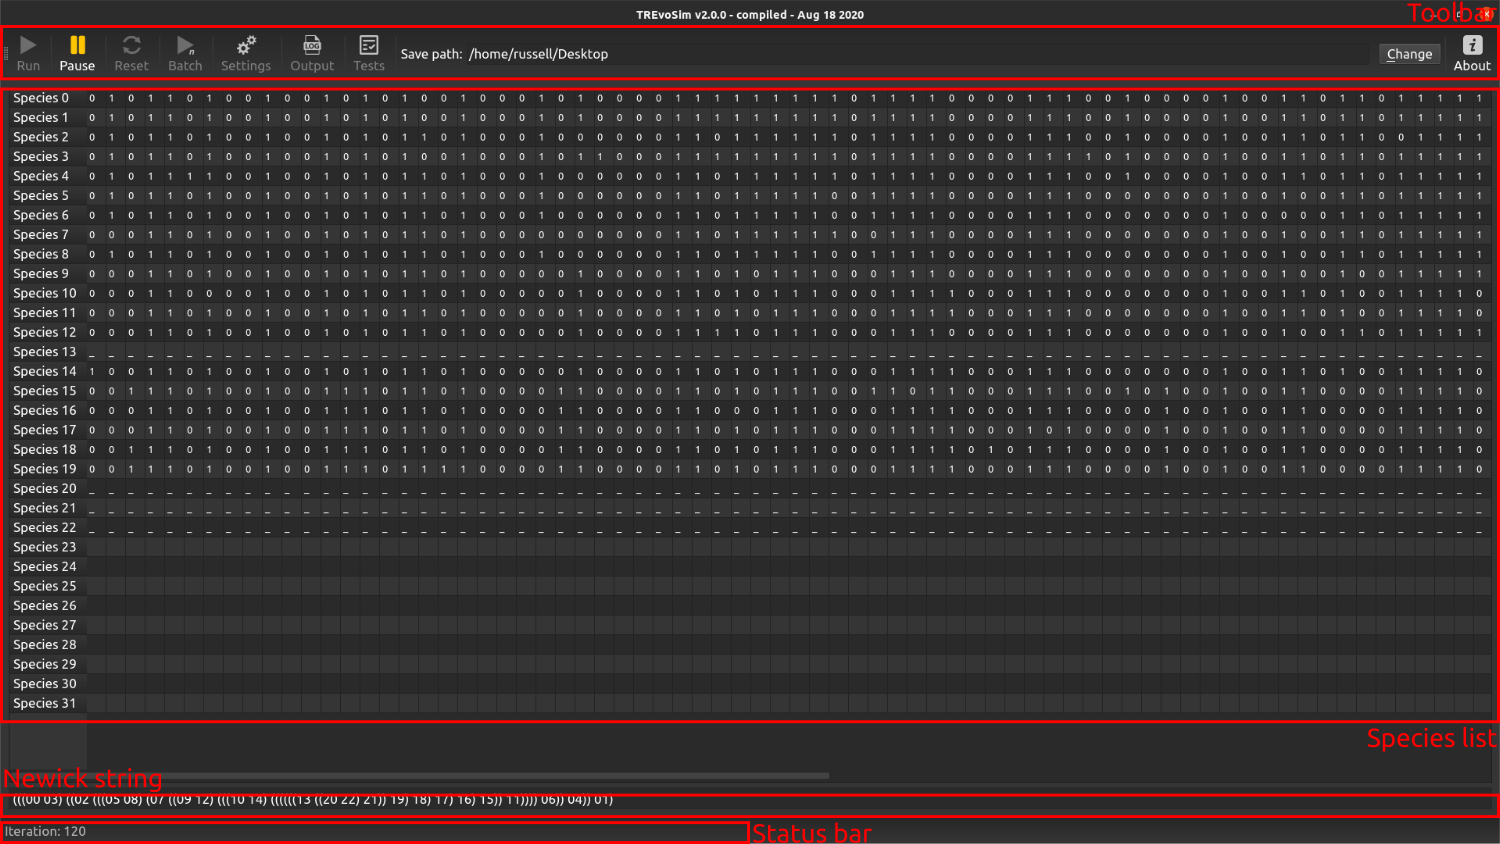
The main window comprises a number of elements, outlined below.
5.1. Toolbar
The main toolbar appears with the pause and stop buttons greyed out (disabled) when the simulation is not running:

And when it is running, these are enabled, and all other buttons are disabled:

The buttons control the simulation, as well as launching dialogues, whilst the Save path text box defines the program output location.
- Run
This button launches a simulation, and then runs it until the requested number of species has evolved (see Settings - Organisms and simulation ), the simulation is paused, or cancelled (escape key).
- Pause
Pauses simulation, which can be resumed when requested by pressing pause again.
- Reset
Resets the simulation by removing all digital organisms from the playing field and species list.
- Batch
For repeated runs using the same settings, TREvoSim provides a batch mode. The number of runs is requested on launching batch mode, and output files are labelled accordingly. On launching a batch run, TREvoSim will complete the first run in serial, updating the GUI, allowing it to provide warnings at the end of the run (and provide the opportunity to cancel). After this, all remaining batches will be completed in parallel (note that this speeds up each simulation significantly: the duration of the first run is not a particularly good indicator of how long you should expect the batch to run for in total).
- Settings
Launches Settings - Organisms and simulation dialogue.
- Output
Launches Logging the Simulation dialogue.
- Tests
Runs the TREvoSim test suite, reporting test results in a new panel that appears on the right of the main window.
- Save path
All files created by the program are written to a folder titled TREvoSim_output, created in this location.
- Change
Launches a file explorer to change the save path.
- About
Opens a dialogue with information about TREvoSim, and links to the code and for bug reporting.
5.2. Species list
This panel updates as a run of the simulation progresses: it shows the binary string for the species in a simulation (up to the first 128 characters are displayed), once available. If the simulation is running to a taxon number, it is presented as a grid at the start of a simulation, in run to iteration it starts as a single line and expands as species originate. For any species that is extant (i.e. there is a living representative in the playing field), the species is represented by a series of dashes. Once the species is extinct, and characters have been recorded (see Algorithm, Concepts, and Experimental Design for more details), these are printed to the panel.
5.3. Newick string
This text box updates with a Newick string showing the tree of the current simulation run, which updates as speciation events occur. This provides an immediate picture of, for example, the tree asymmetry within a run.
5.4. Status bar
The status bar is updated with messages during and after a run: for example, during a run it displays the iteration number, and afterwards it can provide messages about the data (e.g. number of uninformative characters, if these are not set to be stripped out, number of identical terminals). It also displays progress bars where one is required.